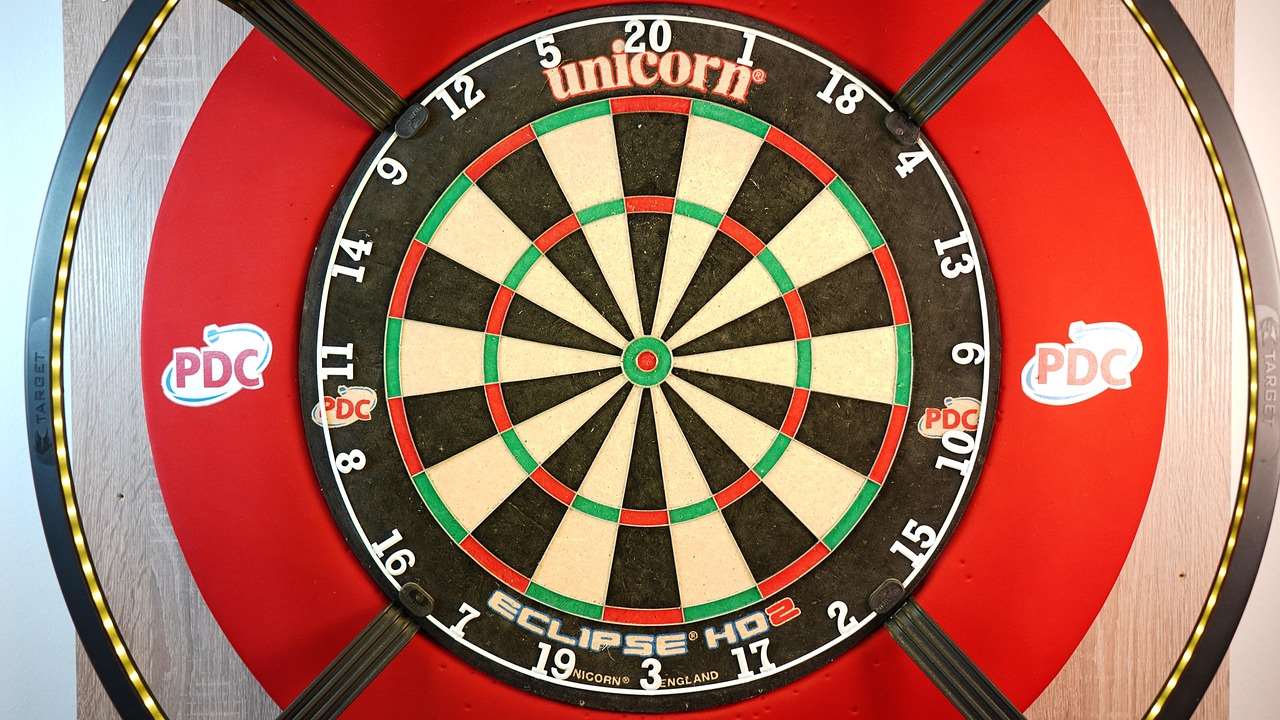
Explaining adapted dart rules becomes significantly easier and more engaging when incorporating visual aids. This article explores various **visual aids for explaining adapted dart rules**, providing practical examples and strategies to help players of all levels understand rule modifications quickly. We’ll cover everything from simplified dartboard diagrams to interactive scoring systems.
⚠️ Still Using Pen & Paper (or a Chalkboard)?! ⚠️
Step into the future! The Dart Counter App handles all the scoring, suggests checkouts, and tracks your stats automatically. It's easier than you think!
Try the Smart Dart Counter App FREE!Ready for an upgrade? Click above!
The Power of Visuals: Why Use Them for Adapted Dart Rules?
Trying to explain complex or nuanced rules using only words can often lead to confusion, especially when dealing with adapted versions of the traditional dart game. Visual learning is a powerful tool that can help bridge this gap. When adapting darts rules for beginners, visuals become indispensable.
- Improved Comprehension: Visuals make abstract concepts concrete and easier to grasp.
- Increased Engagement: A well-designed visual aid can capture attention and maintain interest.
- Enhanced Retention: People are more likely to remember information presented visually.
- Reduced Confusion: Visuals can clarify ambiguities and prevent misunderstandings.

For instance, if you are adapting darts rules for beginners, a simple visual showing the reduced throwing distance can be far more effective than simply stating the distance change.
Types of Visual Aids for Explaining Adapted Dart Rules
The best type of visual aid will depend on the specific rule you’re explaining and the audience you’re targeting. Here are several effective options:
Simplified Dartboard Diagrams
Traditional dartboards can seem daunting to new players. Create simplified diagrams that:
- Highlight Scoring Zones: Clearly identify the single, double, and triple zones.
- Use Color-Coding: Assign different colors to each scoring zone for quick identification.
- Omit Unnecessary Details: Focus only on the essential scoring areas for beginners.
You can even use software to create interactive dartboard diagrams where players can click on different sections to see the corresponding score. This is especially helpful when explaining how to make darts fairer with handicap rules.
Scoring Trackers and Charts
Keep track of scores and game progress visually with scoring trackers and charts. These can be:
- Simple Scoreboards: Basic charts showing each player’s score and remaining points.
- Interactive Apps: Digital apps that automatically calculate scores and display game statistics.
- Progress Bars: Visual representations of how close each player is to winning.
These aids are particularly beneficial when implementing simplified 501 game rules for novice players, as they reduce the mental burden of tracking scores.

Flowcharts for Game Rules
For complex adapted rules, flowcharts can be invaluable. They visually map out the steps of the game, showing what happens under different conditions. Consider using flowcharts to explain:
- Special Rule Triggers: When a specific event triggers a change in the game.
- Alternative Scoring Systems: How to calculate scores in unique game variations.
- Handicap Adjustments: How handicaps are applied to different players.
For example, if you are designing fun dart game variations with modified rules, a flowchart can clearly illustrate the sequence of events and special scoring conditions.
Video Demonstrations
Video demonstrations are excellent for showing adapted dart rules in action. Create short videos that:
- Show Rule Examples: Demonstrate how the adapted rule is applied in a real game scenario.
- Use Slow Motion: Highlight key moments to clarify any ambiguities.
- Provide Commentary: Explain the rule and its implications as the demonstration unfolds.

This can be particularly useful when adapting dart game rules for children, as they often learn best by seeing examples.
Infographics for Quick Reference
Infographics are ideal for presenting key information in a concise and visually appealing format. Use infographics to summarize:
- Core Rule Changes: Clearly state the modifications made to the standard rules.
- Scoring Differences: Highlight any changes to the scoring system.
- Game Objectives: Summarize the goal of the adapted game.
Consider using icons and images to further enhance comprehension. If you’re brainstorming creative dart rules for parties and social gatherings, an infographic can quickly communicate the unique twists of each game.
Creating Effective Visual Aids: Best Practices
Creating effective visual aids for explaining adapted dart rules requires careful planning and attention to detail. Keep the following best practices in mind:
Keep It Simple
Avoid overwhelming the audience with too much information. Focus on the essential elements and use clear, concise language.
Use Consistent Design
Maintain a consistent visual style across all your aids. Use the same fonts, colors, and layout to create a cohesive and professional look.
Target Your Audience
Tailor your visuals to the specific needs and preferences of your audience. What works for experienced players may not be suitable for beginners. Consider the age and skill level of the target audience when adapting darts rules for home play.

Test and Refine
Get feedback on your visual aids and make adjustments as needed. Test them with a small group of players and solicit their opinions. This iterative process will help you create the most effective visuals possible.
Choose the Right Format
Consider the context in which the visual aid will be used. A large poster may be suitable for a tournament, while a small handout may be better for individual practice. Similarly, when modifying rules for mixed-level dart players, printed handouts might be helpful.
Digital Tools for Creating Visual Aids
Numerous digital tools can help you create professional-looking visual aids:
- Canva: A user-friendly graphic design platform with a wide range of templates and design elements.
- Adobe Illustrator: A powerful vector graphics editor for creating complex diagrams and illustrations.
- Microsoft PowerPoint: A versatile presentation tool that can be used to create simple visual aids and slideshows.
- Google Slides: A free, web-based presentation tool that offers similar functionality to PowerPoint.
- специализированные Apps: Dart scoring apps often offer customizable display options.

Exploring these tools can significantly improve the clarity and impact of your visual aids for explaining adapted dart rules.
Examples of Successfully Explained Adapted Dart Rules Using Visuals
Let’s look at some concrete examples of how visual aids can clarify common rule adaptations.
Handicap Systems
Challenge: Explaining how handicaps are applied to level the playing field between players of different skill levels.
Visual Aid: A table showing each player’s starting score or the number of points they need to deduct from their final score. Color-coding can be used to differentiate between players with different handicaps. This helps to visually represent how to make darts fairer with handicap rules.
Simplified Scoring
Challenge: Teaching new players how to score when using simplified rules, such as only counting darts that land in the large numbered sections.
Visual Aid: A dartboard diagram highlighting only the relevant scoring zones, with the other sections greyed out or removed. This focuses attention on the essential areas and simplifies the scoring process.
Adapted Throwing Distances
Challenge: Demonstrating the correct throwing distance when playing with adapted rules for children or players with mobility limitations. Especially useful when adapting darts rules for small spaces: tips and tricks.
Visual Aid: A photograph or diagram showing the standard throwing distance compared to the adapted distance, with clear measurements indicated. A video demonstration showing a player throwing from the adapted distance can also be effective.
Conclusion
Visual aids for explaining adapted dart rules are indispensable tools for enhancing comprehension, engagement, and retention. By incorporating simplified dartboard diagrams, scoring trackers, flowcharts, video demonstrations, and infographics, you can significantly improve the learning experience for players of all levels. Remember to keep your visuals simple, consistent, and tailored to your audience. Ready to put these tips into practice? Start creating your own **visual aids** today and transform the way you explain and enjoy adapted dart games! Check out Basic Darts Fundamentals for Beginners for more information.
Hi, I’m Dieter, and I created Dartcounter (Dartcounterapp.com). My motivation wasn’t being a darts expert – quite the opposite! When I first started playing, I loved the game but found keeping accurate scores and tracking stats difficult and distracting.
I figured I couldn’t be the only one struggling with this. So, I decided to build a solution: an easy-to-use application that everyone, no matter their experience level, could use to manage scoring effortlessly.
My goal for Dartcounter was simple: let the app handle the numbers – the scoring, the averages, the stats, even checkout suggestions – so players could focus purely on their throw and enjoying the game. It began as a way to solve my own beginner’s problem, and I’m thrilled it has grown into a helpful tool for the wider darts community.