Analyzing Player 180s Per Leg offers a powerful insight into darting performance, revealing consistency and scoring prowess. This article will explore how to effectively analyze this metric, its significance in evaluating players, and how it can be used to predict match outcomes, alongside delving into other related statistical areas.
⚠️ Still Using Pen & Paper (or a Chalkboard)?! ⚠️
Step into the future! The Dart Counter App handles all the scoring, suggests checkouts, and tracks your stats automatically. It's easier than you think!
Try the Smart Dart Counter App FREE!Ready for an upgrade? Click above!
Why Analyzing Player 180s Per Leg Matters
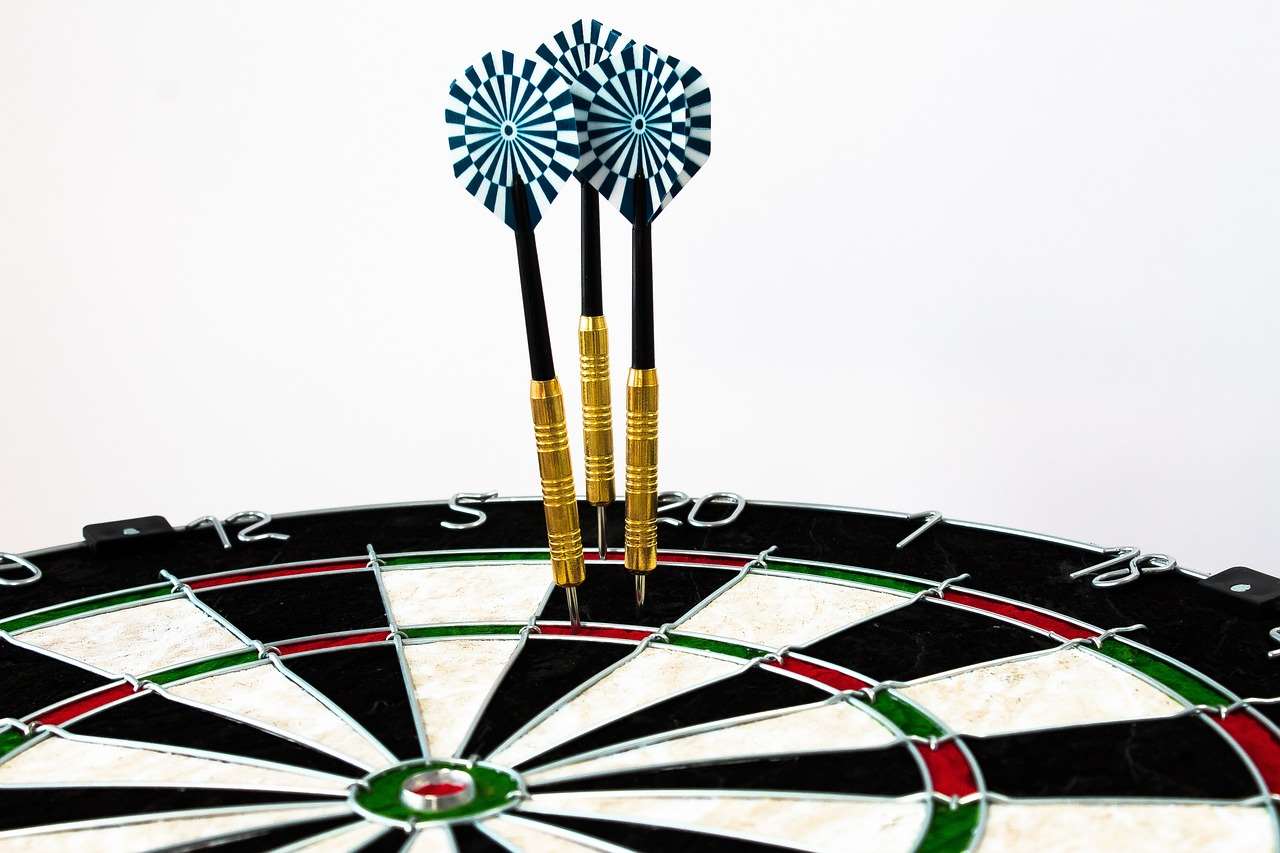
The 180, or maximum score in a single visit to the oche (throwing area), is the most iconic moment in darts. While averages provide a general overview of a player’s scoring ability, analyzing player 180s per leg offers a more granular view, showing their ability to hit maximums under pressure within the context of a single leg. This is crucial because darts is a game of legs, and consistently hitting 180s significantly increases the chances of winning each leg and ultimately, the match. Understanding the frequency and timing of these maximums helps gauge a player’s temperament and their knack for crucial scoring moments.
Consider this: Player A might have a slightly higher overall average than Player B, but if Player B consistently hits more 180s per leg, especially at critical junctures, they are likely to apply more pressure and secure more victories. It’s not just about raw scoring power; it’s about converting opportunities into leg wins.
Understanding 180 Frequency and Distribution
When analyzing player 180s per leg, look beyond just the total number of 180s hit in a match. The distribution of those 180s throughout the legs is equally important. Did a player hit all their 180s in the first few legs, or were they spread evenly throughout the match? A consistent distribution suggests a more stable performance under pressure. Conversely, a clumped distribution might indicate streaky form or an inability to maintain maximum scoring consistently. This can have a massive impact betting sponsorship darts.
Factors Influencing 180s Per Leg
Several factors can influence a player’s 180s per leg ratio. These include:
- Player Form: A player’s current form is the most obvious factor. Players in good form tend to hit more 180s.
- Match Pressure: The level of pressure in a match can significantly impact a player’s ability to hit 180s. High-stakes matches often lead to more cautious play.
- Opponent’s Style: The opponent’s playing style can also influence 180 frequency. A fast-paced opponent might force a player to take more risks, leading to more attempts at 180s.
- Dart Setup: The type of darts, flights, and shafts a player uses can affect their accuracy and consistency.
- Physical Condition: Fatigue, stress, and even hydration levels can impact a player’s ability to perform at their best.
It’s important to consider these factors when analyzing player 180s per leg, as they provide context for the numbers.
The Impact of First Nine Darts Average
A strong “first nine darts average” often correlates with a higher probability of hitting 180s. If a player consistently sets themselves up well in the early stages of a leg, they’ll have more opportunities to target the treble 20. Conversely, a poor start can put them under pressure and reduce their chances of hitting maximums.

How to Calculate 180s Per Leg
Calculating 180s per leg is straightforward. Simply divide the total number of 180s hit by a player in a match by the total number of legs they played in that match. For example, if a player hits six 180s in a 12-leg match, their 180s per leg ratio is 0.5. Tracking this statistic over time can reveal trends in a player’s performance.
However, relying solely on a single match’s data is not ideal. Averages taken over a larger sample size (e.g., the last 10 matches) provide a more accurate reflection of a player’s current form. You can use online resources, darting databases, or even create your own spreadsheet to track this data.
Using 180s Per Leg for Predictive Analysis
While not foolproof, analyzing player 180s per leg can be a valuable tool for predictive analysis, especially within the context of Darts Betting And Fantasy Leagues Guide. Players with a consistently high 180s per leg ratio are generally more likely to win matches. However, it’s important to combine this statistic with other performance indicators, such as checkout percentage and overall average, for a more comprehensive assessment. Consider also darts sponsorship and betting for additional insights.
For example, a player with a high 180s per leg ratio but a low checkout percentage might struggle to convert their scoring opportunities into leg wins. Conversely, a player with a lower 180s per leg ratio but a high checkout percentage might be more efficient at finishing legs despite not hitting as many maximums. The key is to analyze these statistics in conjunction with each other.
Beyond Averages: Delving Deeper into 180 Data
While the average number of 180s per leg provides a valuable overview, there’s more to discover by delving deeper into the data. Consider:
- 180s in Winning Legs vs. Losing Legs: Do players hit more 180s when they’re winning or losing? This can reveal their ability to perform under pressure.
- 180s Before or After a Break of Throw: Hitting a 180 immediately before or after a break of throw can be a significant momentum shifter.
- 180s in Crucial Legs (e.g., Deciding Leg): A player’s ability to hit 180s in the final leg of a match demonstrates their clutch performance.
These nuanced insights can provide a more complete picture of a player’s scoring prowess and mental fortitude.

Tools and Resources for Tracking 180s Per Leg
Several online resources and tools can help you track and analyzing player 180s per leg. These include:
- DartConnect: A popular platform for tracking live scores and statistics in professional darts.
- DartPro: A software program that allows you to track your own performance and analyze your statistics.
- Online Darting Databases: Websites that compile historical data on professional dart players, including their 180s per leg ratios.
By utilizing these resources, you can gain access to a wealth of data that can help you improve your understanding of the game.
The Future of 180 Analysis in Darts
As data analytics becomes increasingly prevalent in sports, we can expect to see even more sophisticated methods for analyzing player 180s per leg and other darting statistics. Advanced algorithms and machine learning models could be used to identify patterns and predict performance with greater accuracy. Imagine a future where analysts can predict the likelihood of a player hitting a 180 in a specific situation based on a variety of factors, such as their opponent, the score, and the stage of the match.
This increased level of data analysis could revolutionize the way darts is played and consumed, providing fans with deeper insights and creating new opportunities for betting and fantasy leagues.
Optimizing Your Own Game: Applying 180 Analysis
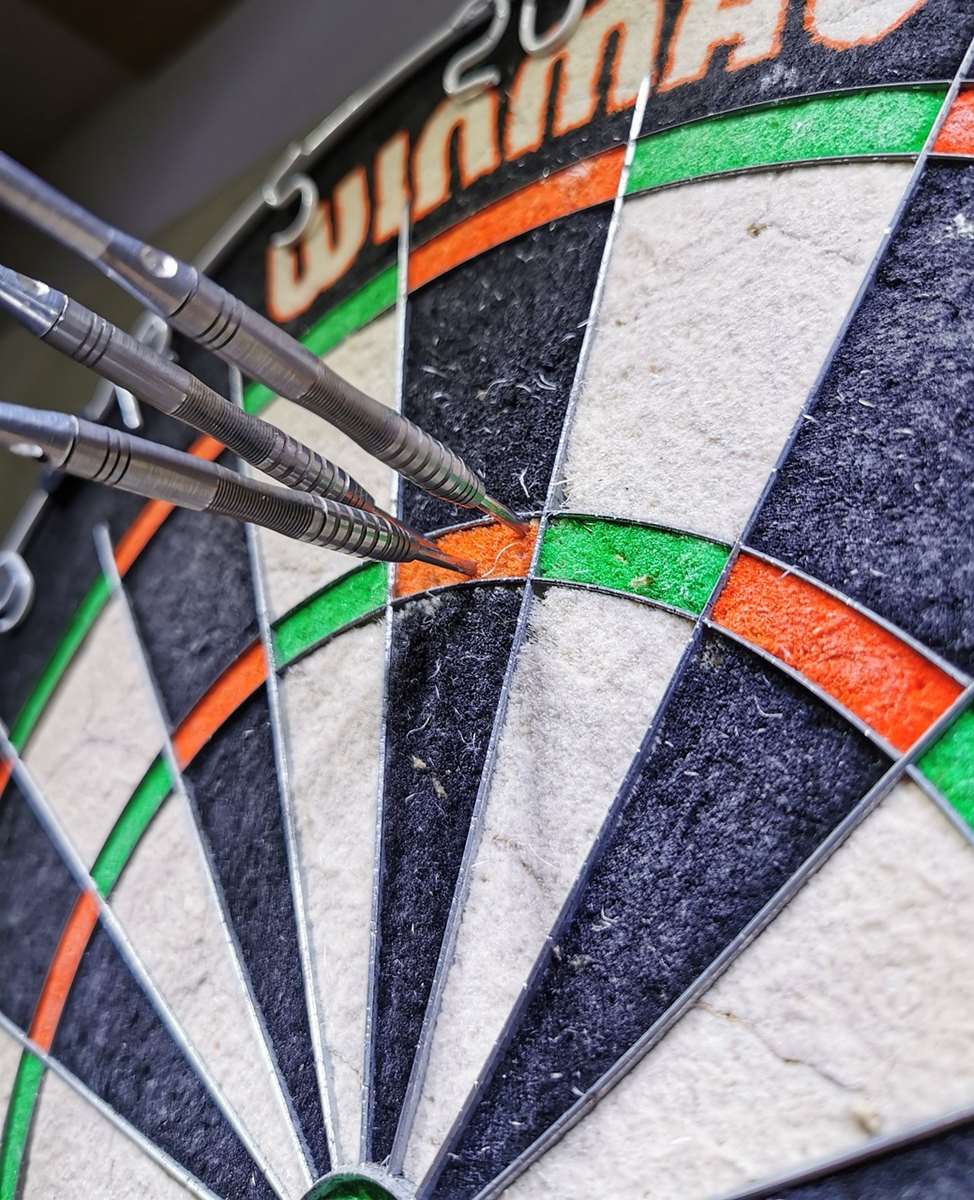
The principles of analyzing player 180s per leg can also be applied to your own game. By tracking your own 180s per leg ratio, you can identify areas for improvement. Are you struggling to hit 180s under pressure? Do you tend to hit more 180s in the early stages of a leg than in the later stages? By identifying your strengths and weaknesses, you can tailor your practice routine to focus on the areas where you need the most improvement. Consider analyzing how betting companies sponsor darts for a different angle.
For example, if you find that you struggle to hit 180s in crucial legs, you might want to incorporate pressure practice into your routine. This could involve simulating match scenarios or playing against opponents who are slightly better than you.
Conclusion: Mastering the Art of 180 Analysis
Analyzing Player 180s Per Leg provides a crucial lens through which to assess darting performance, revealing consistency, clutch scoring ability, and overall dominance. By understanding the factors that influence 180 frequency and distribution, and by utilizing available tools and resources, you can gain a deeper appreciation for the intricacies of the game and enhance your ability to predict match outcomes. So, dive into the data, track those maximums, and unlock the secrets to darting success!
Ready to take your darting knowledge to the next level? Start tracking 180s per leg and other key statistics today! Explore online resources, join a darting league, and continue honing your skills. The more you analyze, the better you’ll understand the game and the more likely you’ll be to achieve your darting goals.
Hi, I’m Dieter, and I created Dartcounter (Dartcounterapp.com). My motivation wasn’t being a darts expert – quite the opposite! When I first started playing, I loved the game but found keeping accurate scores and tracking stats difficult and distracting.
I figured I couldn’t be the only one struggling with this. So, I decided to build a solution: an easy-to-use application that everyone, no matter their experience level, could use to manage scoring effortlessly.
My goal for Dartcounter was simple: let the app handle the numbers – the scoring, the averages, the stats, even checkout suggestions – so players could focus purely on their throw and enjoying the game. It began as a way to solve my own beginner’s problem, and I’m thrilled it has grown into a helpful tool for the wider darts community.